

Gauges for SPC

Description of Gauges for SPC
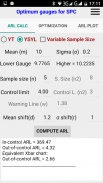
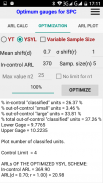
This application permits to develop a control chart (statistical process control) to monitor process shifts employing optimized gauges.
There are two options to monitor the process: 1.- An YT control chart that plots the number of units in the sample that have been classified by the gauge. 2.- Two control charts at the same time: YS control chart, that plots the units classified as small; YL control chart, that plots the units classified as large.
YT is better for monitoring variance shifts, and YS-YL for mean shifts. This monitoring can be applied to process where there are no defective units.
Both schemes can be designed with fixed sample size or with variable sample size.
This application is also available for iOS (iPhone) and OSX (MAC). Just search in their stores.
For Windows, you can download the application from this link:
https://mega.nz/#!bc5xxRab!w_Epgwjhuls4bGFM-0tCHWNbXpqR2RTRixwbvYZ-xu4


